
Overview
A centralized platform that enables investment distributors to manage investors, track brokerage earnings, analyze fund performance, and access reports from one dashboard.
Year
2025
Duration
3 Months
My Role
UI/UX Design & Research
4W + H Framework
Who
Investment distributors and relationship managers managing multiple investors and funds.
What
Distributors lack a centralized system to monitor brokerage earnings, investor commitments, and fund performance.
How
The Distributor Portal centralizes investor data, brokerage calculations, fund analytics, and reporting.
Turning Pain Points Into Features
Fragmented Investor Data
!
Problem
Investor and fund data existed across different systems, leading to inconsistencies.
✓
Solution
A centralized dashboard integrates all investor and fund data in one unified view.
Lack of Brokerage Visibility
!
Problem
Distributors could not easily track brokerage commissions or get breakdowns.
✓
Solution
Brokerage dashboard with detailed payout and transaction insights, updated in real-time.
Manual Reporting
!
Problem
Reports required manual requests from operations teams with long turnaround times.
✓
Solution
Self-service reports module with instant downloads — no waiting, no dependencies.
Difficulty Managing Teams
!
Problem
Distributors lacked visibility into relationship manager performance and hierarchy.
✓
Solution
Team structure module visualizing hierarchy and performance metrics for every RM.
How we Approached the Design
1
Research
Stakeholder interviews, competitive analysis, user observation
2
Information Architecture
Site maps, content structure, navigation hierarchy
3
Wireframes
Low-fidelity sketches and mid-fidelity wireframe flows
4
UI Design
High-fidelity screens with design system and component library
5
Testing
Usability testing, feedback loops, and iterative refinements
Glimpse of Output
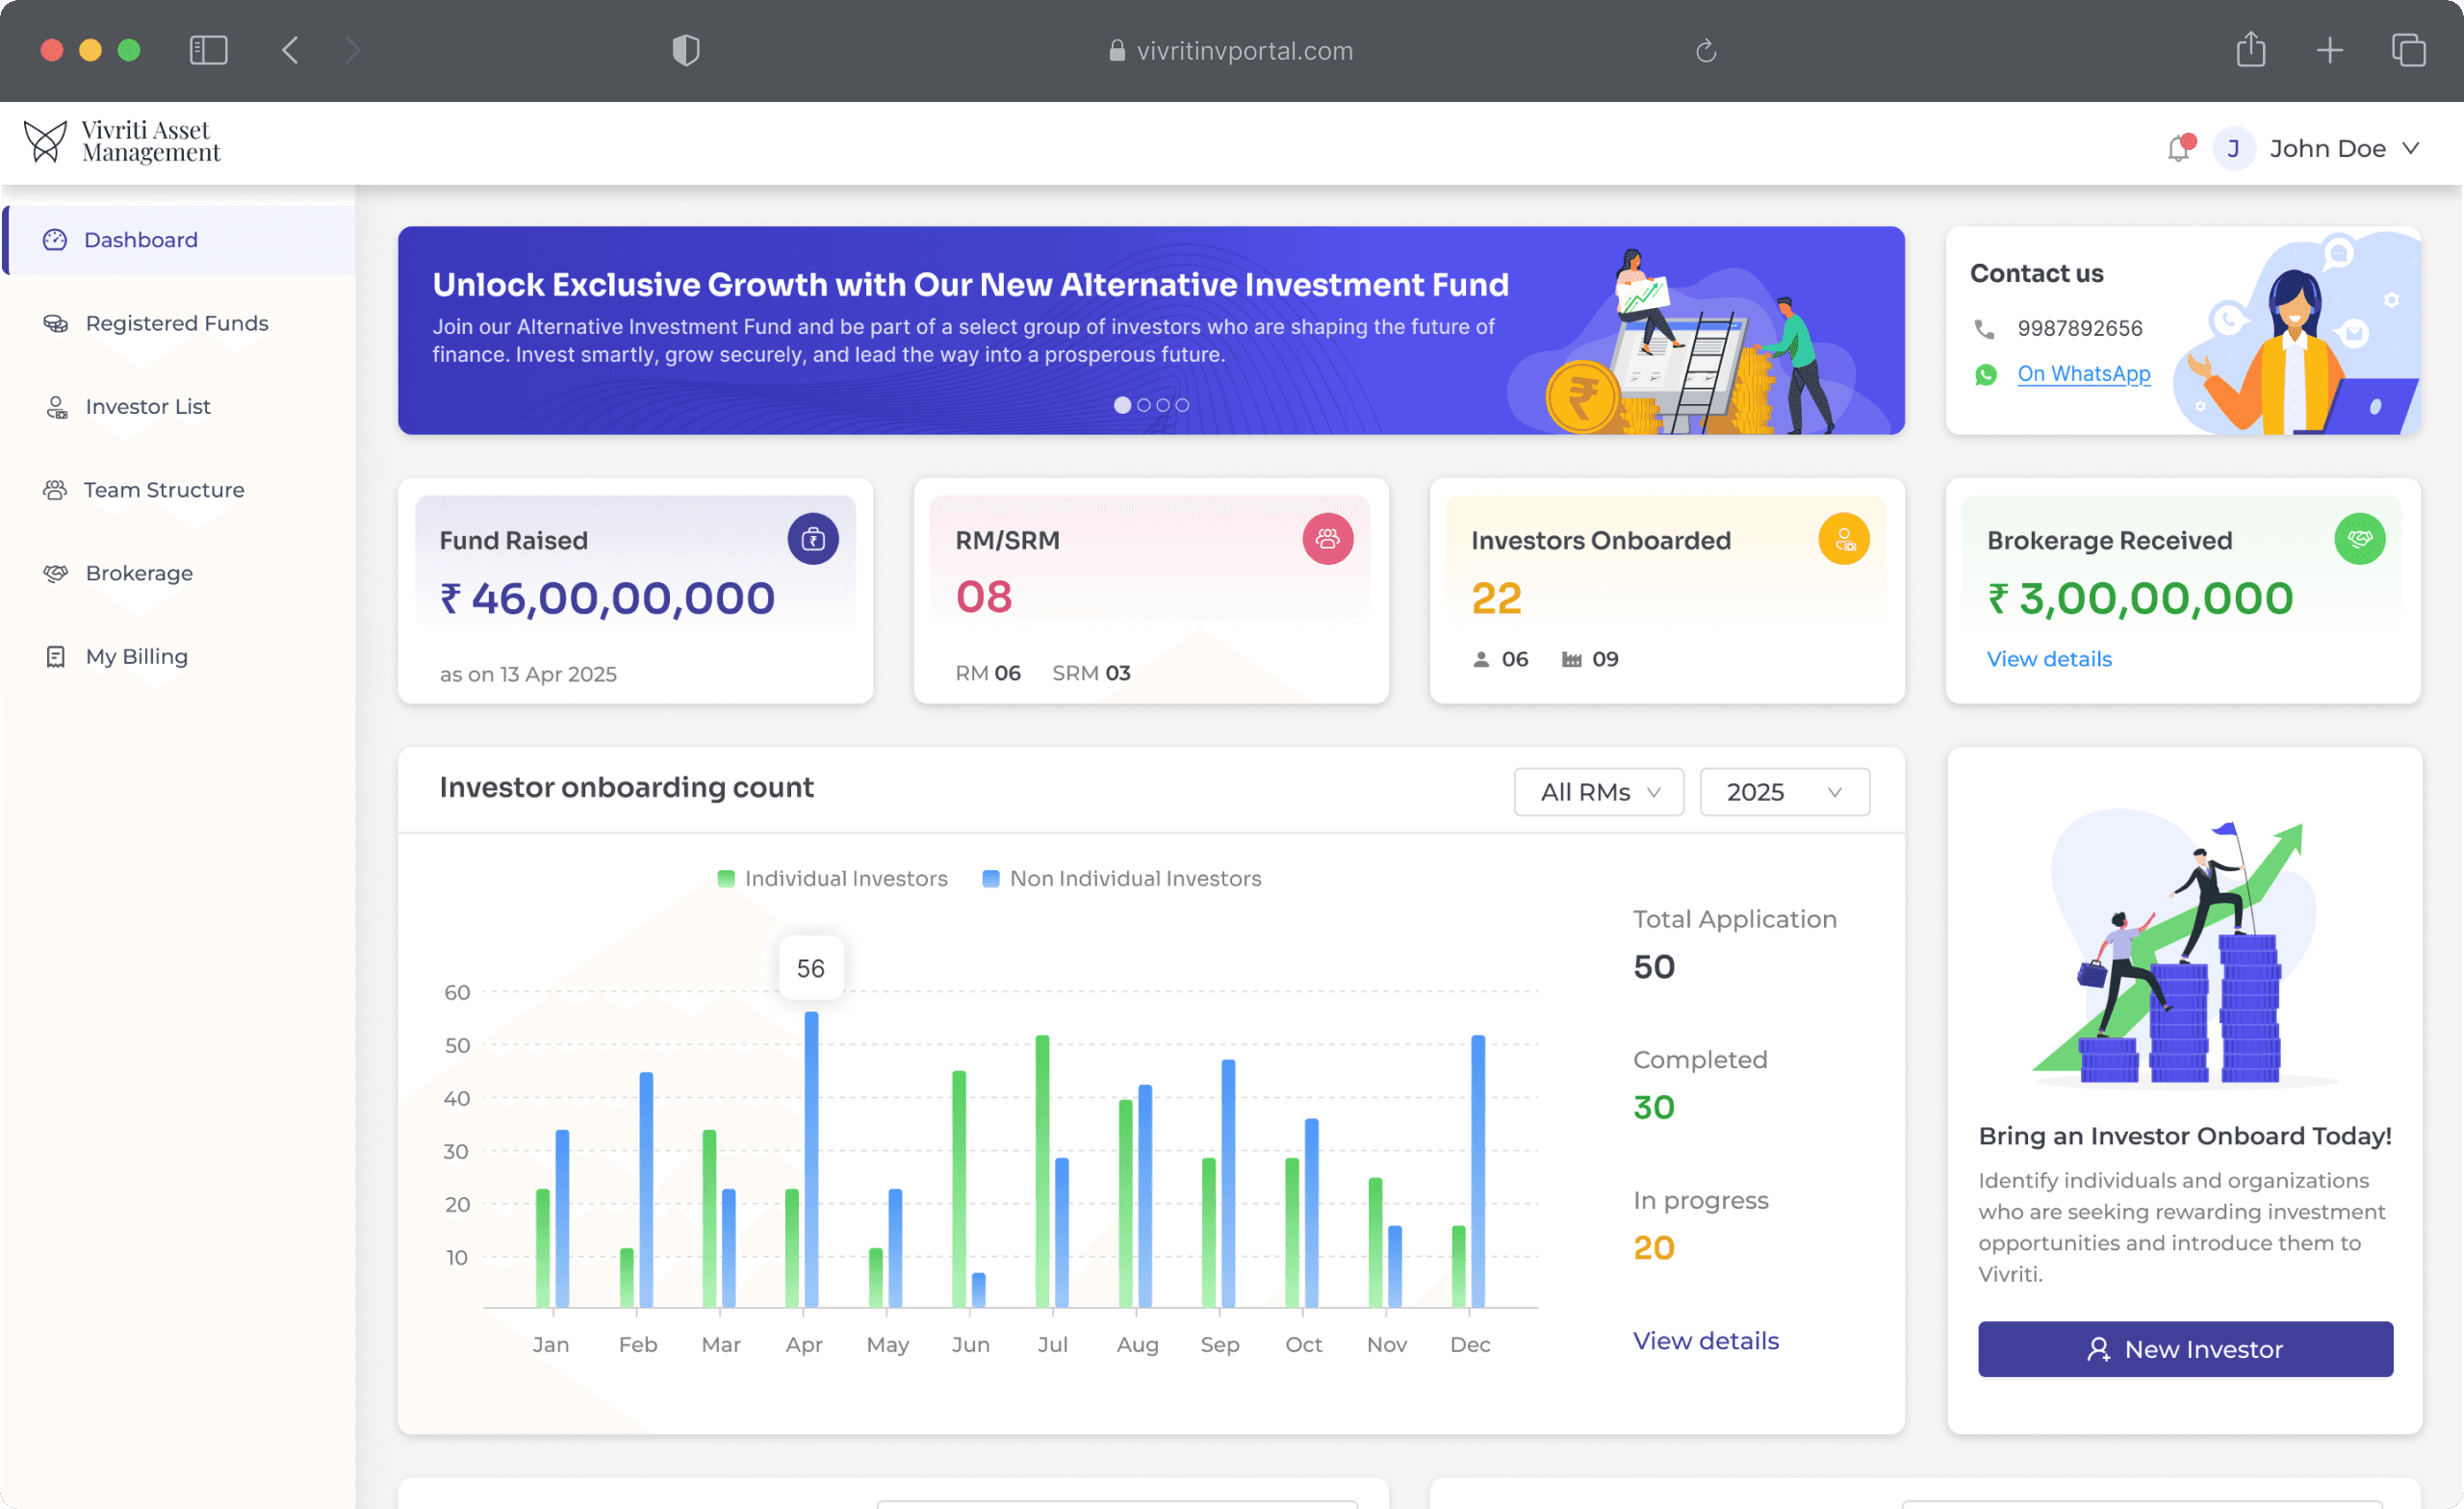
Dashboard Analytics
A unified command center giving distributors a real-time snapshot of AUM, investor count, brokerage earned, and fund performance — all at a glance.
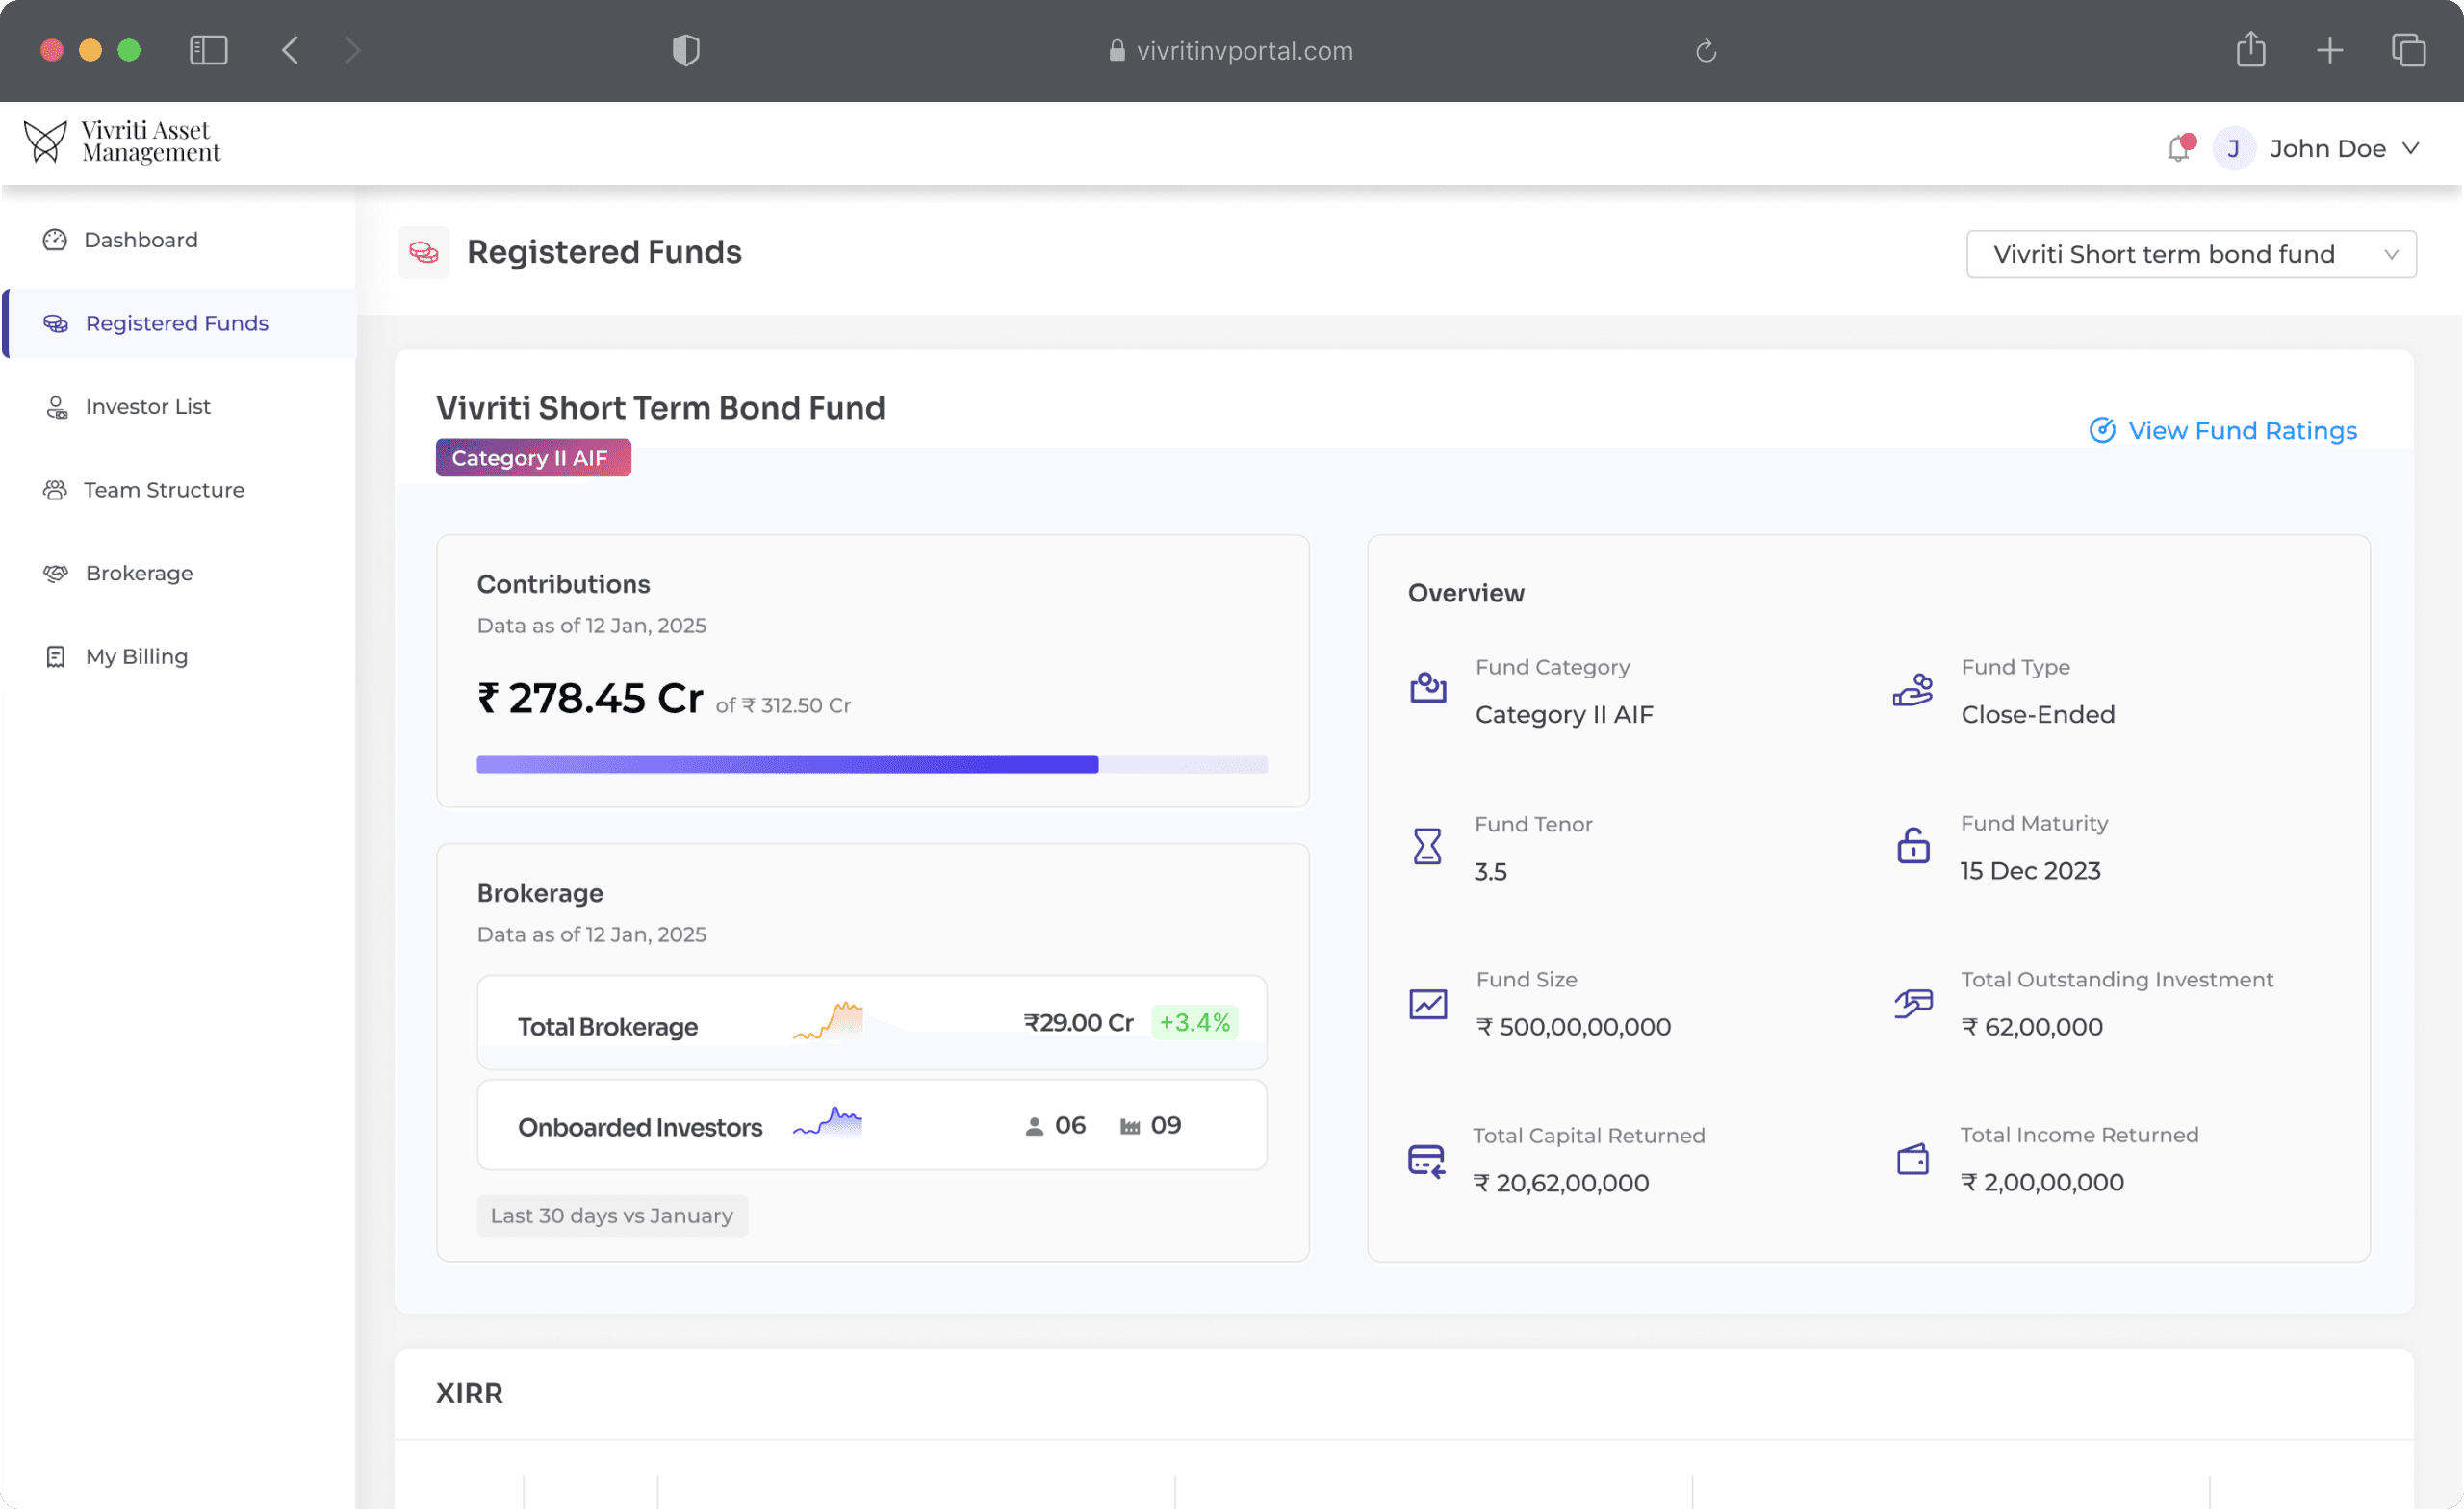
Fund Performance Tracking
Monitor XIRR, NAV growth, and drawdown status for all registered funds with elegant performance charts and fund-level drill-downs.
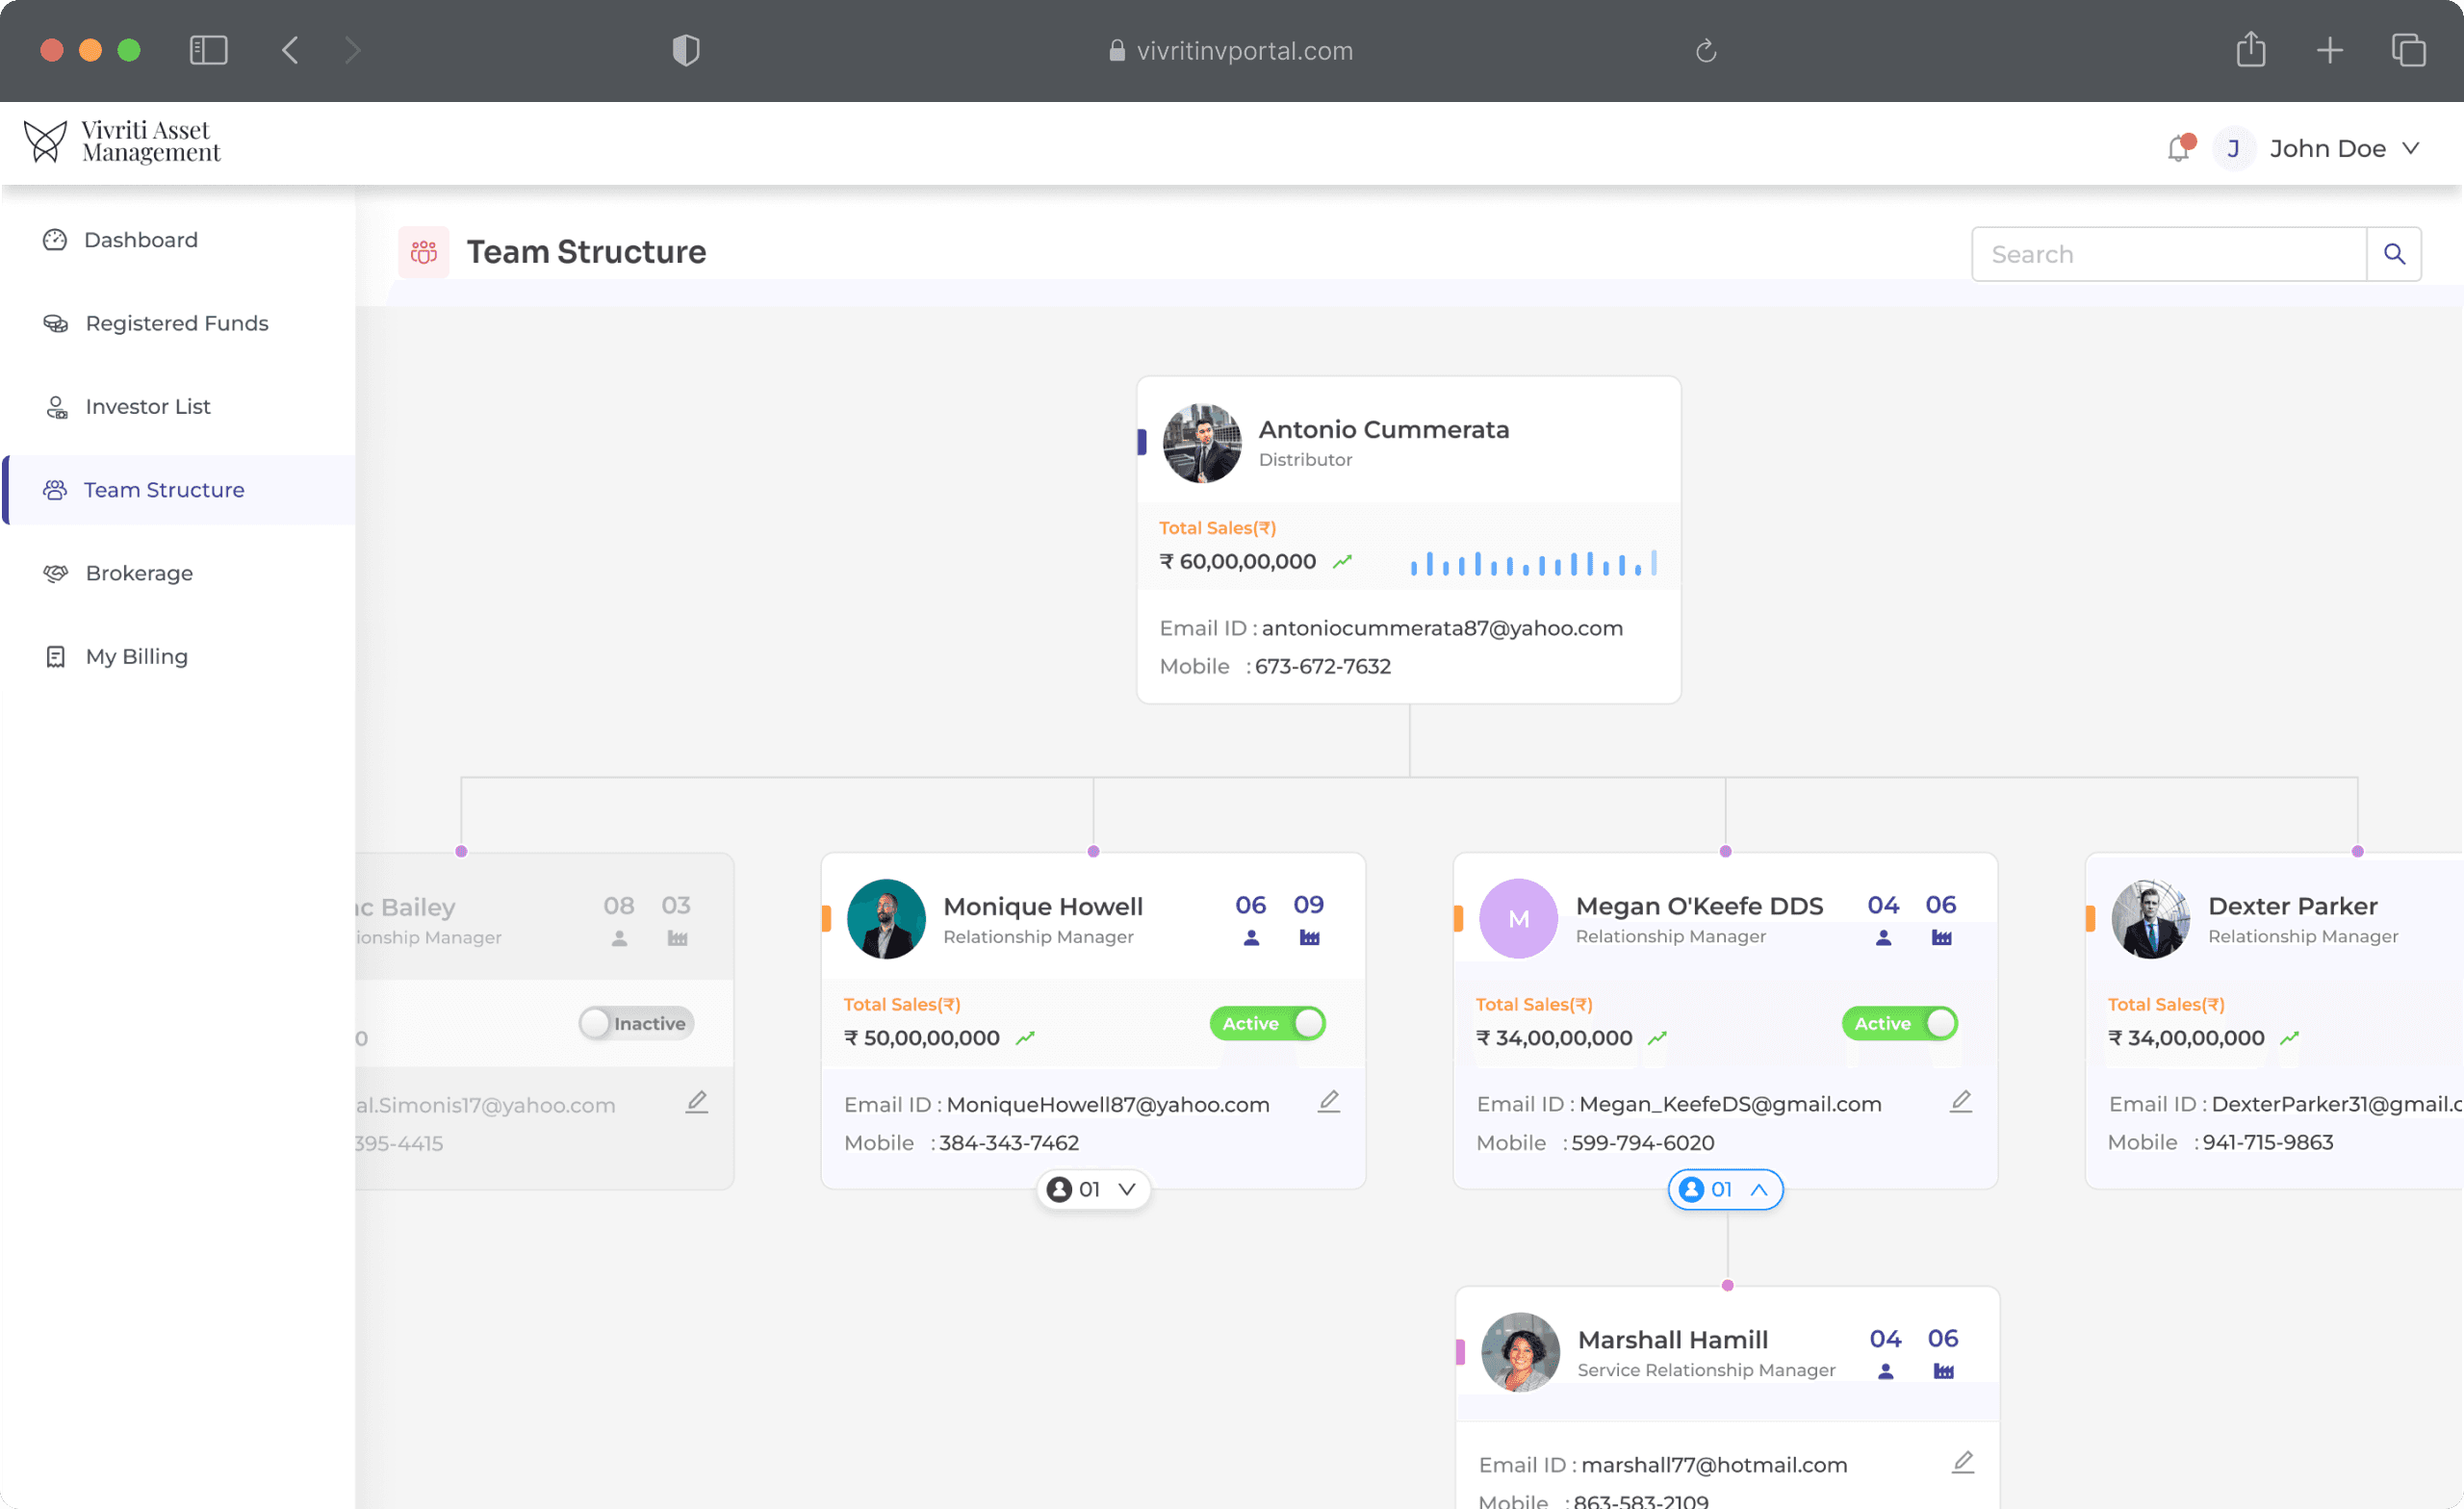
Team Structure Visualization
A hierarchical view of relationship managers with performance metrics, investor assignments, and goal tracking for better team oversight.
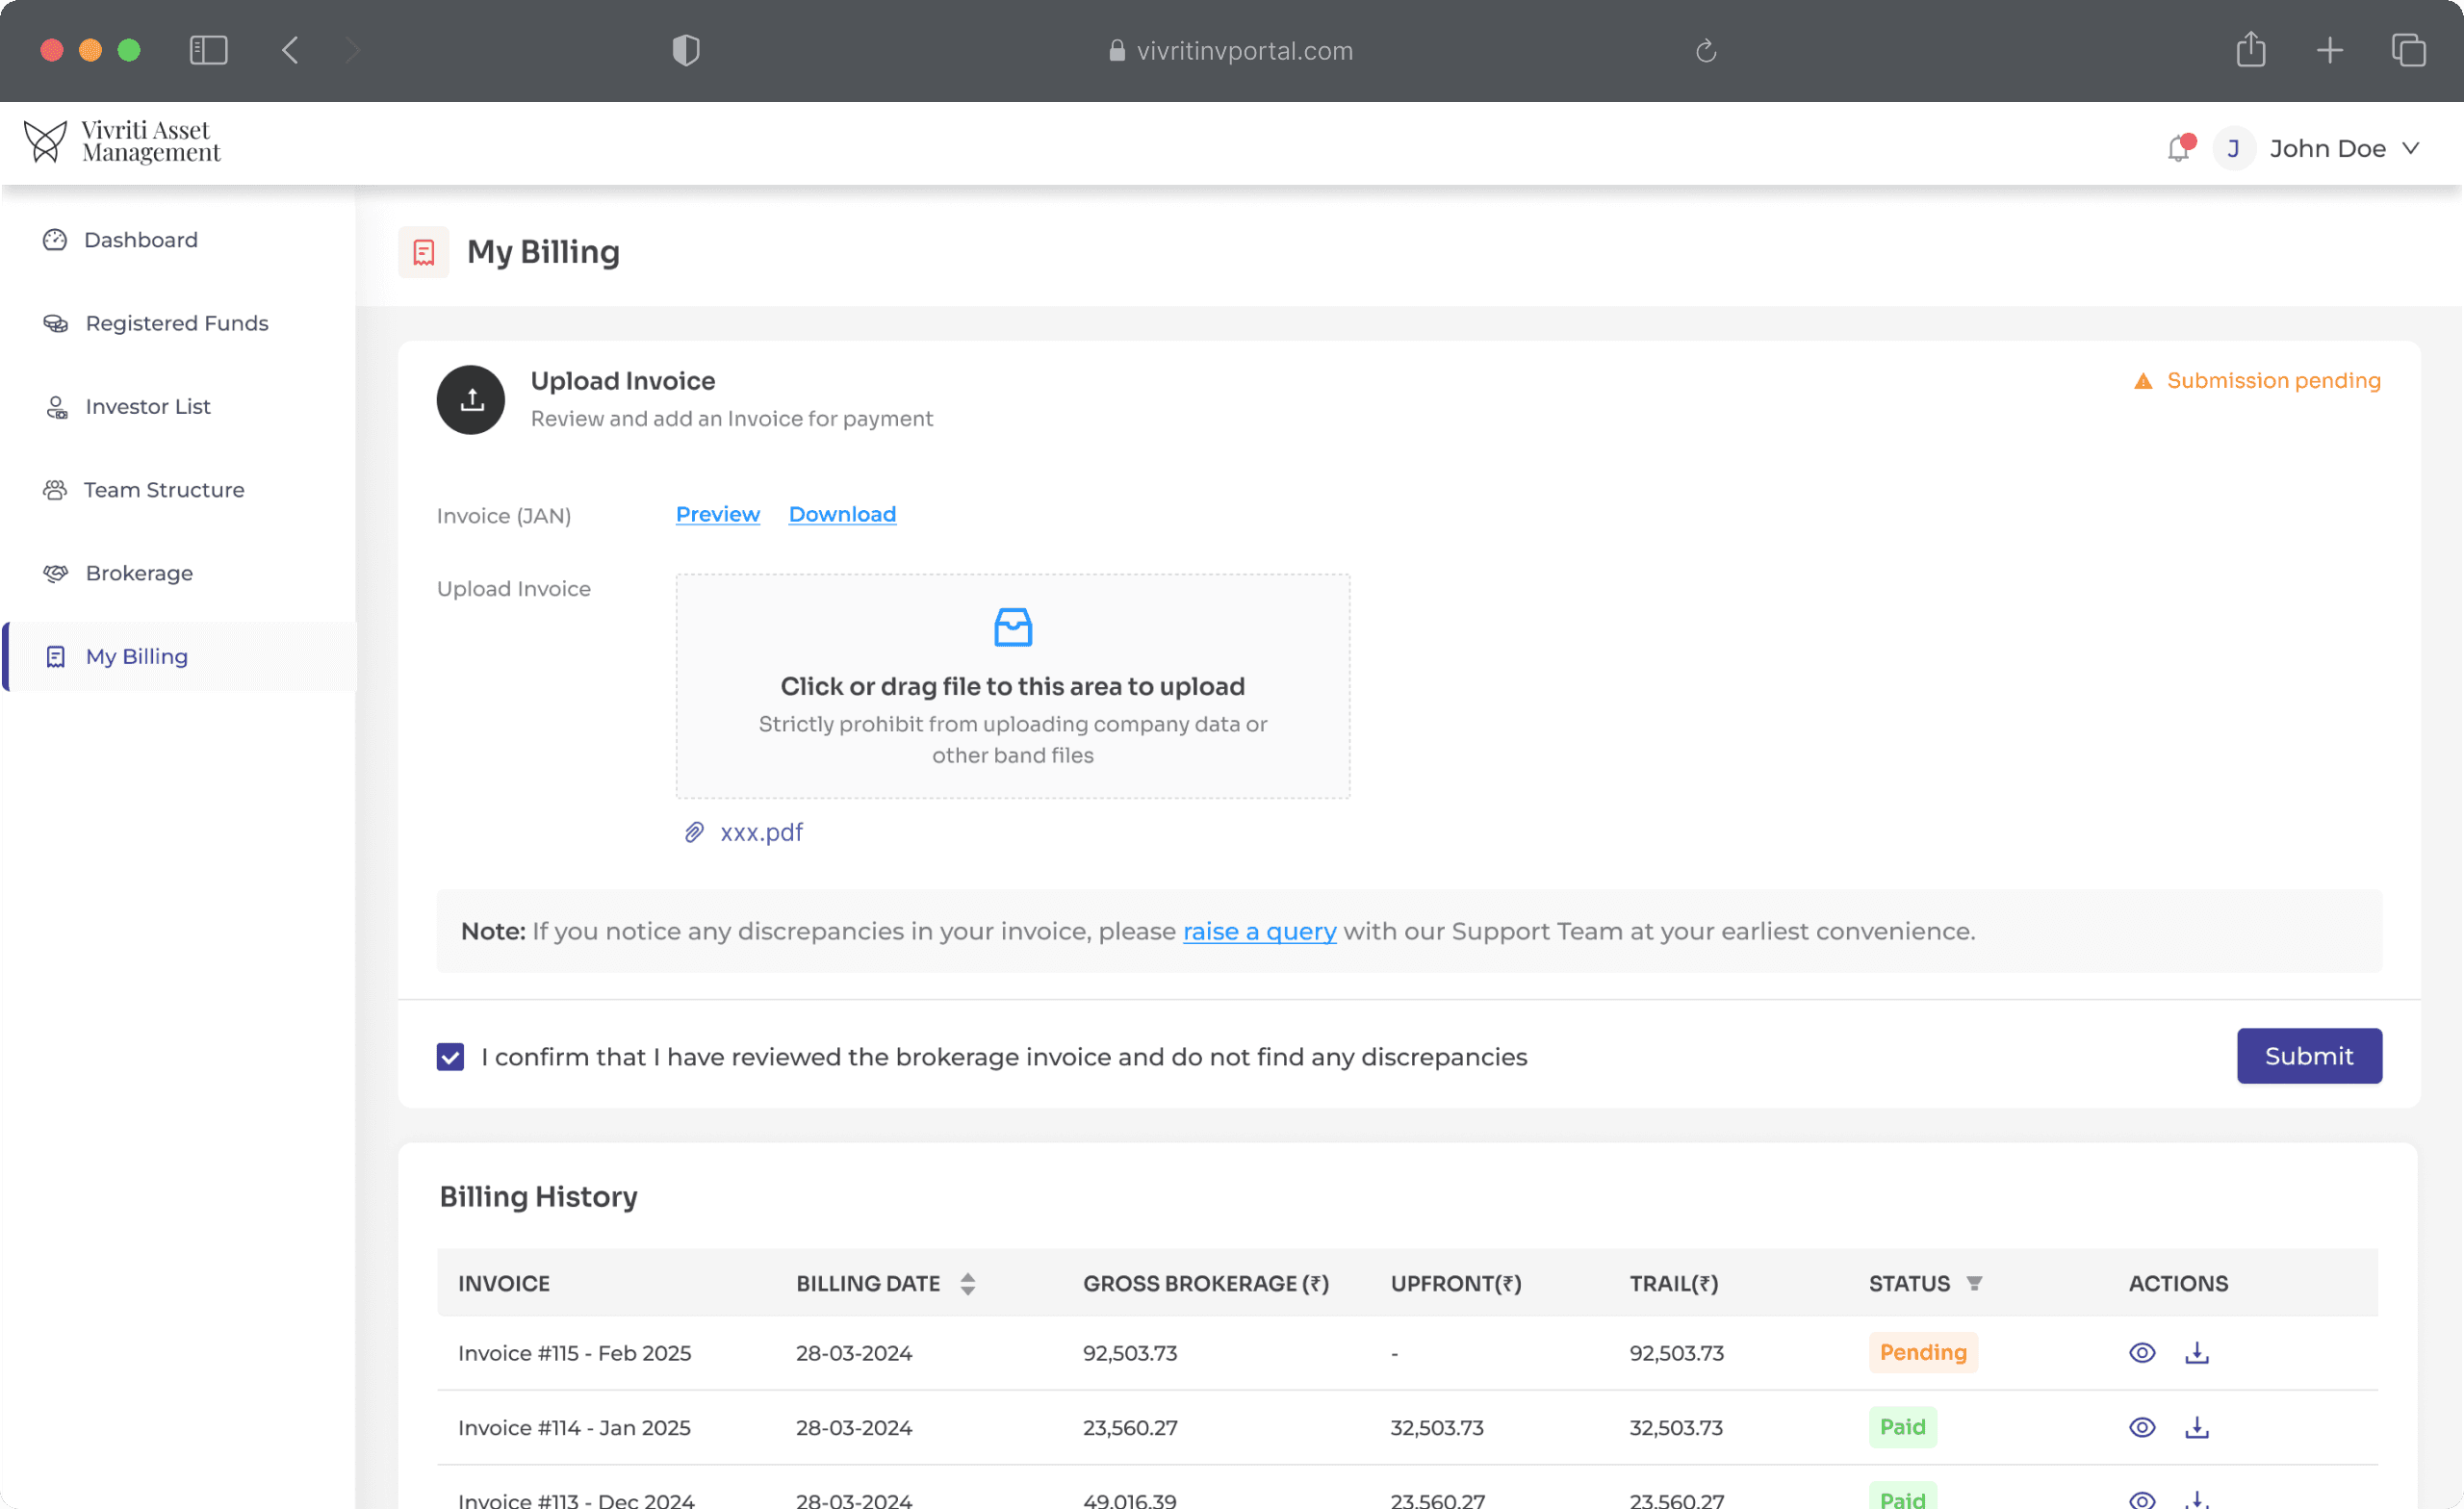
Billing & Invoice Management
Submit invoices, monitor payment status, and keep all billing documents organized.
Key Takeaways
Simplifying Complex Financial Data
Breaking down financial information into visual dashboards dramatically improved usability and reduced the learning curve for new users.
65%
Faster data access
Transparency in Brokerage
Clear commission calculations with real-time breakdowns significantly increased distributor trust and reduced support queries.
40%
Fewer Support Tickets

